Migratory birds use the Earth’s magnetic field as one of their compasses. So when a solar storm shakes that field, you might expect some of them to stay on the ground. In 2023, Gulson-Castillo and colleagues looked for this in US weather radar data and found it: on strongly disturbed nights, nocturnal migration over the Great Plains was 9 to 17% lower, with the bigger drop in spring.
Europe has its own radar archive, and as far as I can tell nobody had asked whether the effect shows up there. So I asked. The short answer is no. The longer answer is mostly about how to ask a question like this without fooling yourself, so that is most of this post.
The data
Aloft publishes vertical profiles of bird density from about 150 European weather radars, processed with vol2bird, going back to 2012. For each radar and night I took the mean vertically integrated density of birds aloft. Geomagnetic activity comes from the planetary Kp index (NASA OMNI2): a night counts as a storm night if Kp reached 6− and as quiet if it stayed below 5−. Weather comes from ERA5 through Open-Meteo, because wind decides most of what birds do on any given night, and storms do not care about wind.
The model is unglamorous. Predict each radar-night’s migration from weather, season and location, then ask whether storm nights sit below their predictions more than quiet nights do. The answer is a single percentage: how much less (or more) migration on storm nights than on quiet ones.
Freeze first, then look
Here is the structural point, and it matters more than any of the statistics.
An analysis has many choices: which nights count, which radars pass quality control, which weather variables go in, which contrast is “the” test. If you make those choices after seeing the outcome, you can find almost any effect you want, without meaning to. The fix is to separate the data into two piles and to put a timestamp between them:
- Development data (2014 to 2022): look freely, try models, pick the design.
- Freeze. Write down the model, the quality control, the statistic, the minimum sample, and the verdict rules. Commit it to git. The commit hash is the timestamp.
- Confirmatory data (2023 to 2025): download it only now, run the frozen code once, and read off the verdict.
One more step turned out to matter. Before freezing, count the storm nights in the confirmatory years using only space-weather data, without touching a single bird. That tells you how much the test can possibly see. I learned that one the hard way on an earlier project, where a held-out test came back inconclusive because nobody had counted.
The verdict rules had three outcomes, fixed in advance:
- PASS: the 95% interval for the storm-night change lies entirely below zero. The drop is real.
- FAIL: not PASS, and the data rule out a US-sized drop of 17% or more (a one-sided test at the 5% level).
- INCONCLUSIVE: anything else. Too noisy to say.
Note what FAIL means. It does not mean “no effect at all”. It means “not an effect as large as the one reported in the US”.
Autumn: FAIL
Autumn 2023 to 2025 had 23 storm nights, each seen by a median of 47 radars, plus 266 quiet nights. The estimate was −2.9% (95% CI −9.5% to +4.1%). A 17% drop is ruled out. FAIL.
Then came the temptation. Looking at the results afterward, the 12 strongest nights (Kp 7− or above) showed −9.3%, with an interval well clear of zero. That is exactly the kind of number that gets written up as “the effect is there, but only for strong storms”. But I chose that cut after seeing the data, so it is a hypothesis, not a result. The only honest thing to do with it is to test it on data it has not seen.
Spring: FAIL, twice
Spring 2023 to 2025 was untouched, so I froze a test of the strong-storm lead on it. The count was sobering: only 8 nights at Kp 7− or above, from 7 separate storms. With that few, the test had about a 1 in 9 to 1 in 3 chance of detecting a real 9% drop. The likely outcome was INCONCLUSIVE whatever the truth.
So, before downloading any spring data, I amended the plan. The broader Kp ≥ 6− contrast had 26 nights from 18 storms, and it tests the question that actually matters for spring, where the US drop was largest. It got its own verdict, with the autumn rule. To keep two tests from doubling the chance of a lucky PASS, they ran in a fixed order: the broad test first, and the strong-storm test allowed to PASS only if the broad one passed too. The amendment went into git as its own commit, still before any spring radar file was on disk.
Both came back FAIL, and both pointed the wrong way:
| spring 2023 to 2025 | storm nights (storms) | change vs quiet nights | 95% CI |
|---|---|---|---|
| Kp ≥ 6− | 25 (18) | +9.2% | −1.2% to +20.8% |
| Kp ≥ 7− | 8 (7) | +10.2% | −10.1% to +35.0% |
If anything, there was slightly more migration on storm nights. The strong-storm lead from autumn did not survive.
The sign keeps flipping
Put every estimate of the main contrast on one axis, development years included:
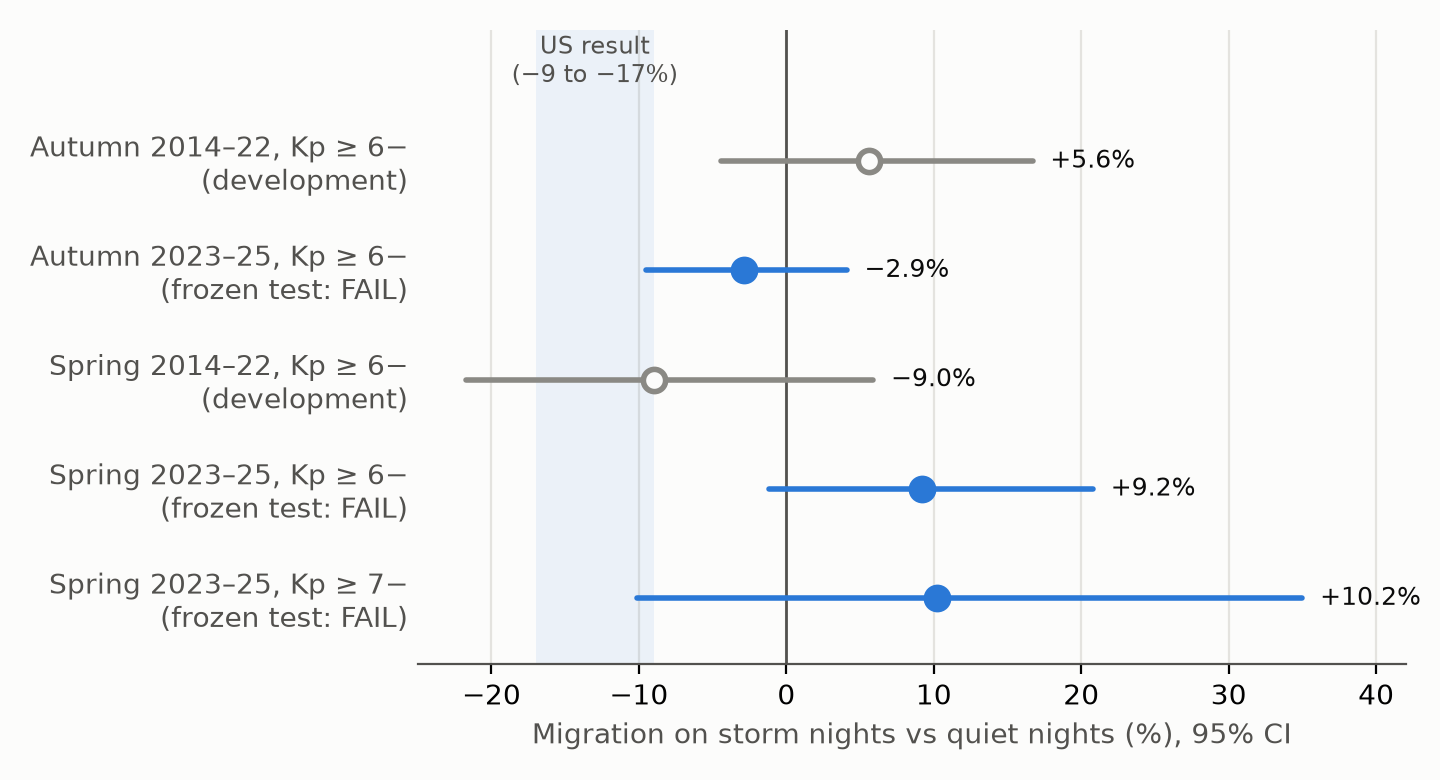
Autumn development +5.6%, autumn confirmatory −2.9%, spring development −9.0%, spring confirmatory +9.2%. Two up, two down, and no seasonal pattern. The simplest reading is no storm effect at all, plus period-to-period noise. Storm nights are few and tend to share continent-wide weather, so a handful of unusual nights can push a three-year estimate around by several percent in either direction. I don’t read the spring +9% as birds liking storms.
Did the test have a chance?
A null result is only worth something if the method could have found the effect. So I injected one: scale migration down by 9% or 17% on storm nights in the real data, rerun the frozen pipeline, and see what comes out. Repeated thousands of times with shuffled storm dates:
| frozen test | chance of PASS if the true drop is 9% | if 17% | chance of PASS if there is no effect |
|---|---|---|---|
| autumn Kp ≥ 6− | 54% | 99% | 1.8% |
| spring Kp ≥ 6− | 62% | 99% | 4.7% |
| spring Kp ≥ 7− | 26% | 59% | 1.8% |
A US-sized 17% drop would almost certainly have been caught in either season. A 9% drop is a coin flip for any single test, which is why “FAIL” only rules out 17% on its own. What argues against 9% is where the estimates actually landed. Under a true 9% drop, a spring estimate as high as +9.2% never happened in 5,000 simulations. The autumn estimate is weaker evidence: about 1 simulation in 8 lands that high under a true 9% drop.
So, plainly: the European data rule out the US-sized effect in both seasons, rule out a 9% drop in spring, and lean against it in autumn.
What this is and isn’t
This does not show the US result is wrong. The US study used a local measure of magnetic disturbance from nearby magnetometers, not the planetary Kp index, and at European latitudes the same Kp means very different things in Spain and in Lapland. I did check a local measure from 20 European observatories in autumn, and it was null too, but that was a rougher version of their exposure, and spring has no local check. Other gaps: wind at 100 m stands in for wind at flight altitude, quality control drops about half the radar-seasons (for noise, decided before the test), and the European radar network, its processing and its flyways all differ from the Great Plains.
What it does show: the effect, at the sizes reported, does not carry over to European weather-radar data. That is worth knowing if you work with these data, and worth recording in case anyone else is tempted by the strong-storm subgroup the way I was.
How this was made
This came out of a project where I point AI agents (Claude, here) at public scientific archives and look for questions nobody has checked. The agent searched the literature, wrote the pipeline, ran the analyses and the simulations, and drafted text. I steer the project, decide what gets frozen and when, and decide what gets posted. The frozen plans, their commit hashes and the code are in the Zenodo record, doi:10.5281/zenodo.23584188. It has not been peer reviewed.
Data and credits. Aloft bird profiles (CC0; Desmet et al. 2025), from EUMETNET/OPERA weather radars. Kp from NASA OMNI2 (GSFC Space Physics Data Facility). Weather from ERA5 (Copernicus Climate Change Service) via Open-Meteo. Local magnetic data from INTERMAGNET.
References
- Gulson-Castillo, E. R. et al. (2023). Space weather disrupts nocturnal bird migration. PNAS 120, e2306317120. doi:10.1073/pnas.2306317120
- Desmet, P., Shamoun-Baranes, J. et al. (2025). Biological data derived from European weather radars. Scientific Data 12, 361. doi:10.1038/s41597-025-04641-5
- Bianco, G., Ilieva, M. and Åkesson, S. (2019). Magnetic storms disrupt nocturnal migratory activity in songbirds. Biology Letters 15, 20180918. doi:10.1098/rsbl.2018.0918
Discussion